Cracking the Code of CNT Growth: How Transport Phenomena Shape Deep-Injection Reactors
Published on: August 25, 2025
When I started working on carbon nanotube (CNT) synthesis, one question kept coming up:
why are we still struggling to make CNTs efficiently at large scale, despite two decades of research?
CNTs themselves are extraordinary materials: stronger than steel, lighter than aluminum, more conductive than copper.
If we could make them at scale, they could transform everything from aerospace to energy storage.
But most CNTs today are grown by floating catalyst chemical vapor deposition (FCCVD), and the process has persistent bottlenecks:
- Only a small fraction of catalyst particles ever grow CNTs.
- Carbon conversion to CNTs is usually less than 1%.
- Reactor flow patterns are messy, with recirculation zones that trap catalysts in the wrong places.
✅ The missing piece: we don’t fully understand how transport phenomena, flow, mixing, buoyancy, heat transfer - control CNT growth.
The Deep-Injection Twist
Deep Injection (DI) rewrites this story.
Instead of feeding precursors at the reactor inlet, a long, narrow cannula injects them deep into the hot zone.
This sets up a very different flow structure:
- A cold, high velocity jet pushes axially down the center.
- Hot gases recirculate upstream along the walls.
- The shear interface where the two mix becomes the main CNT growth zone.
💡 Growth happens at the interface of cold jet + hot recirculation.
If we control that interface, we control productivity.
Figure 1. Deep Injection reactor. The gases and precursors are injected directly in the hot zone.
Dimensionless Framework
We quantified transport using two key dimensionless numbers:
- Reynolds number (Re):
measures jet momentum vs viscous dissipation.
- Rayleigh number (Ra):
captures buoyancy driven convection relative to diffusion.
Figure 1. Re and Ra as a function of substituting process gas concentration. Lighter gases systematically reduce both.
As lighter gases (He, H₂) replaced Ar, both Re and Ra decreased.
The result: weaker jets, smaller recirculation zones, and reduced overlap between them.
In particular, the drop in Ra indicated that buoyancy-driven convection could no longer sustain large wall recirculation cells, shrinking the effective CNT growth region.
A Tale of Four Gases
Carrier gases were swapped systematically to isolate transport vs chemistry:
Argon vs Nitrogen
Ar and N₂ gave nearly identical results. With similar density and viscosity, flow and productivity remained unchanged.
Helium: A Transport Collapse
Helium’s low density and high diffusivity shorten the jet.
As He concentration increases, the Reynolds number falls.
At a threshold of Re ≈ 260, methane conversion drops sharply:
💡 Below critical Re, the jet cannot sustain overlap with hot recirculation : CNT growth collapses.
The Hydrogen Chemistry
Hydrogen behaves like helium in transport, but chemically it quenches the carbon precursors.
At low levels, it improves selectivity.
At full substitution, methane conversion dropped from ~13% to 0.17% (80× decrease).
Figure 2. CNT conversion vs carrier gas composition.
Productivity Metrics
At the sweet spot (Ar/N₂, proper Re, tuned chemistry), DI-FCCVD achieved:
- Methane conversion: ~13%
- CNT selectivity: >90%
- Productivity: ~430 mg/h
\(P = \frac{m_{CNT}}{t}\)
The selectivity was defined formally as:
\(S_{CNT} = \frac{m_{CNT}}{m_{CNT} + m_{other \, carbon}}\)
These numbers are among the highest reported FCCVD yields.
CFD: Seeing Inside the Reactor
CFD simulations (OpenFOAM) revealed how gas properties reshape jet - recirculation patterns.
- With Ar: jet extends ~0.5 m, overlapping strongly with recirculation.
- With He/H₂: jet collapses early, recirculation shrinks, growth zone disappears.
Figure 3. CFD shows cold jet (blue) and hot recirculation (red). CNT growth occurs at the shear interface.
Velocity and temperature fields from the SI confirm: CNT growth aligns with transport defined zones, not uniform chemistry.
To illustrate the coupling between transport and conversion more clearly, we also compared methane conversion against Reynolds number across conditions:
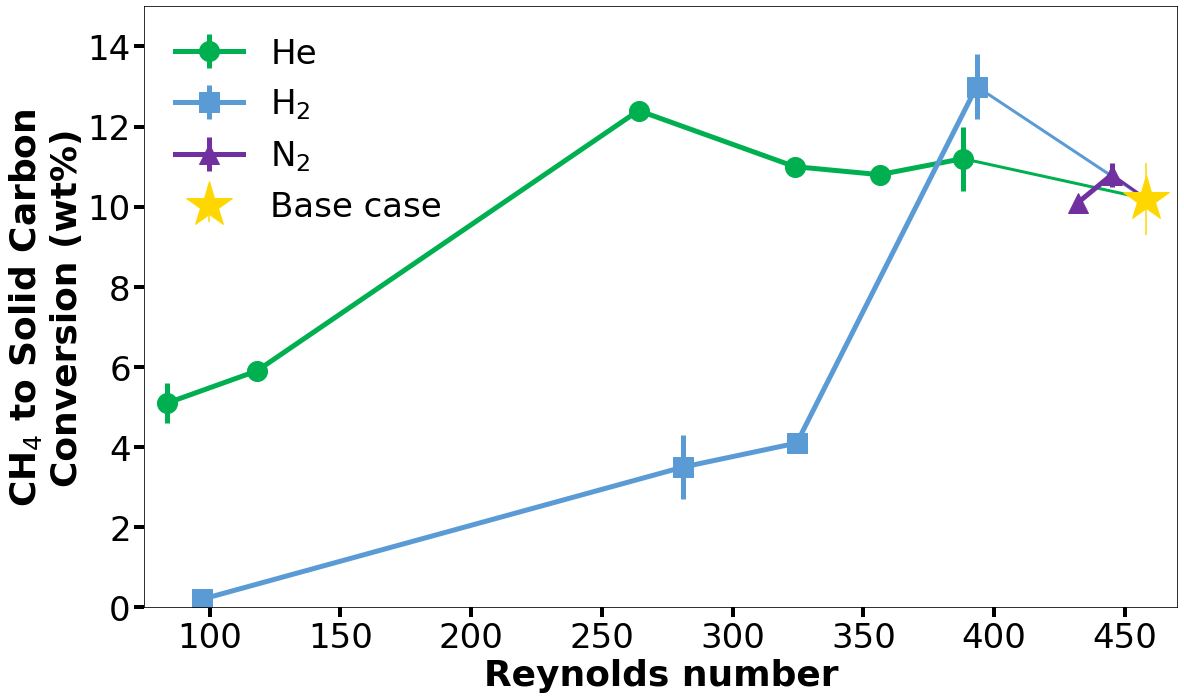
Figure 4. Experimental methane conversion collapses once Re falls below ~260, consistent with CFD predictions of jet shortening.
Why This Matters
This work shows:
- Transport is not passive - it defines the CNT growth zone.
- Chemistry and transport must align - controlling one without the other fails.
- CFD + experiments give a predictive framework for reactor design.
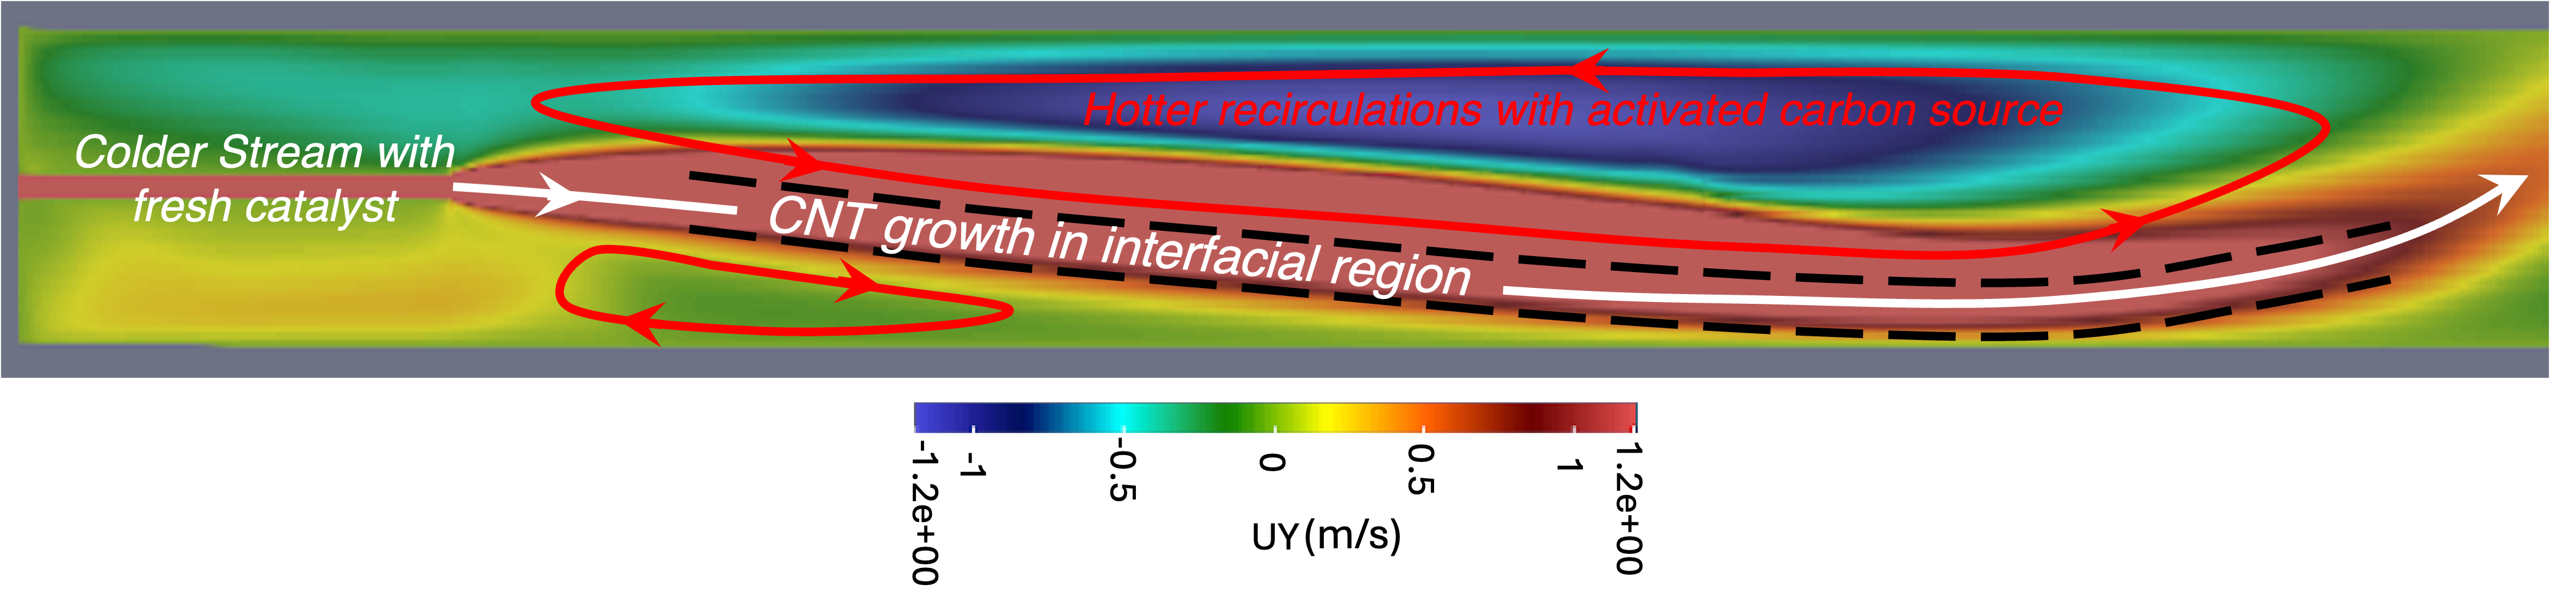
Figure 4. Scheme of suggested mechanism of DI FCCVD reactor.
Instead of blind recipe tweaking, we can now design FCCVD reactors by tuning flow, heat, and chemistry together.
That’s the step CNTs need to move from lab to large scale technology.
📖 Full paper:
Li,Junnarkar,Sloan et al., Carbon (2025) 238:120259