Optical Diagnostics of Iron Nanoparticle Formation in ICP Plasmas
Published on: September 1, 2025
When it comes to carbon nanotube (CNT) synthesis, we often talk about hydrocarbons and catalysts.
But before CNTs ever start to grow, catalyst nanoparticles (NPs) must first form, and their size distribution sets the stage for yield and quality.
Most studies rely on electron microscopy and Raman spectroscopy after synthesis.
The problem: these only tell us what came out, not what happened inside the plasma.
The missing piece: a way to directly measure gas temperatures and nanoparticle formation in situ.
The ICP Platform
To study this, we built a miniature inductively coupled plasma (ICP) system:
- A 1 mm iron wire fed into a quartz tube.
- A 9-turn copper RF coil (27.12 MHz) sustaining the plasma.
- A gas mix of argon with trace nitrogen.
- Diagnostics combining optical emission spectroscopy (OES) and aerosol analyzers (DMA + CPC).
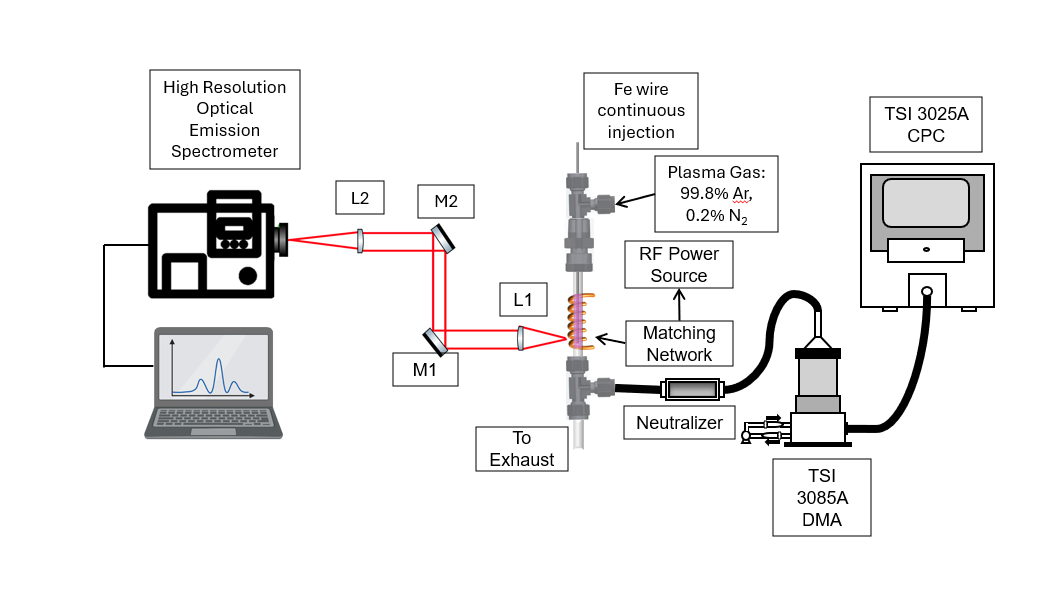
Figure 1. Schematic of the ICP nanoparticle formation setup.
This compact design let us measure plasma conditions (via light) and Fe nanoparticle size distributions (via CPC) simultaneously.
Plasma Light as a Thermometer
OES provided gas temperatures by fitting rotational spectra of N₂ and OH.
Key findings:
- Gas temperature rises with RF power: N₂ rotational spectra reached ~1200 K at 110 W and low flow.
- Flow rate matters: lower flows increased residence time, raising temperatures, but also led to plasma instability.
- N₂ is more reliable than OH: OH(A) states often deviate from equilibrium, while N₂(C) tracks gas temperature closely.
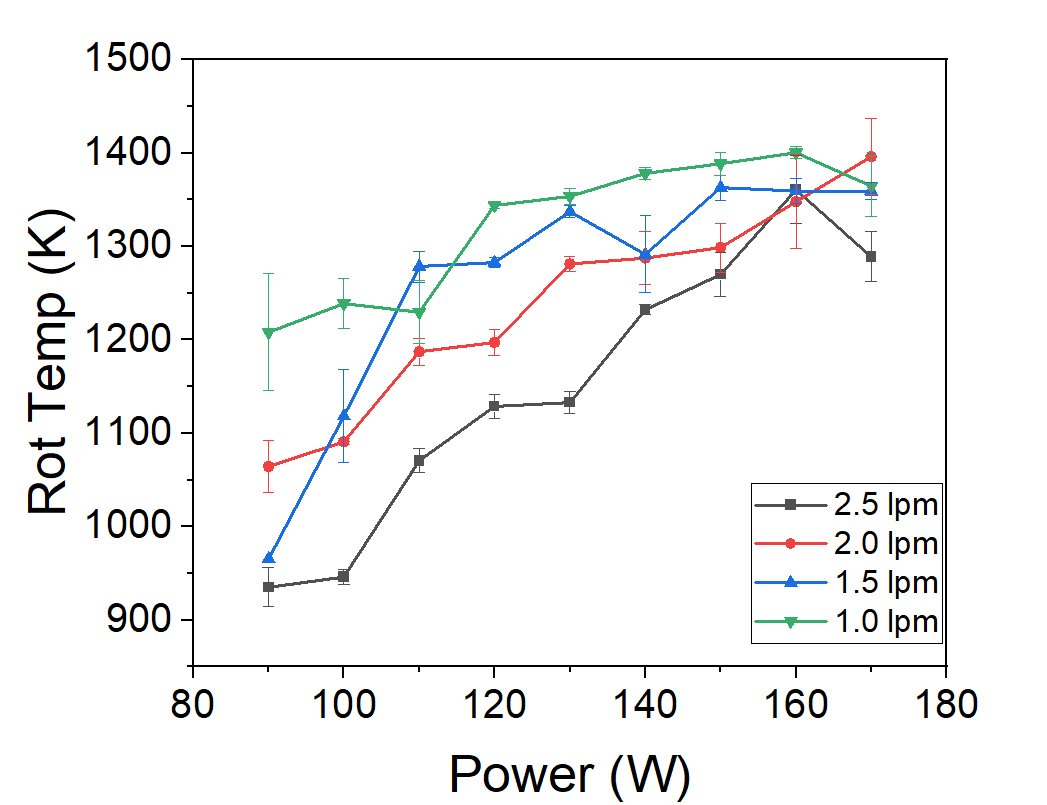
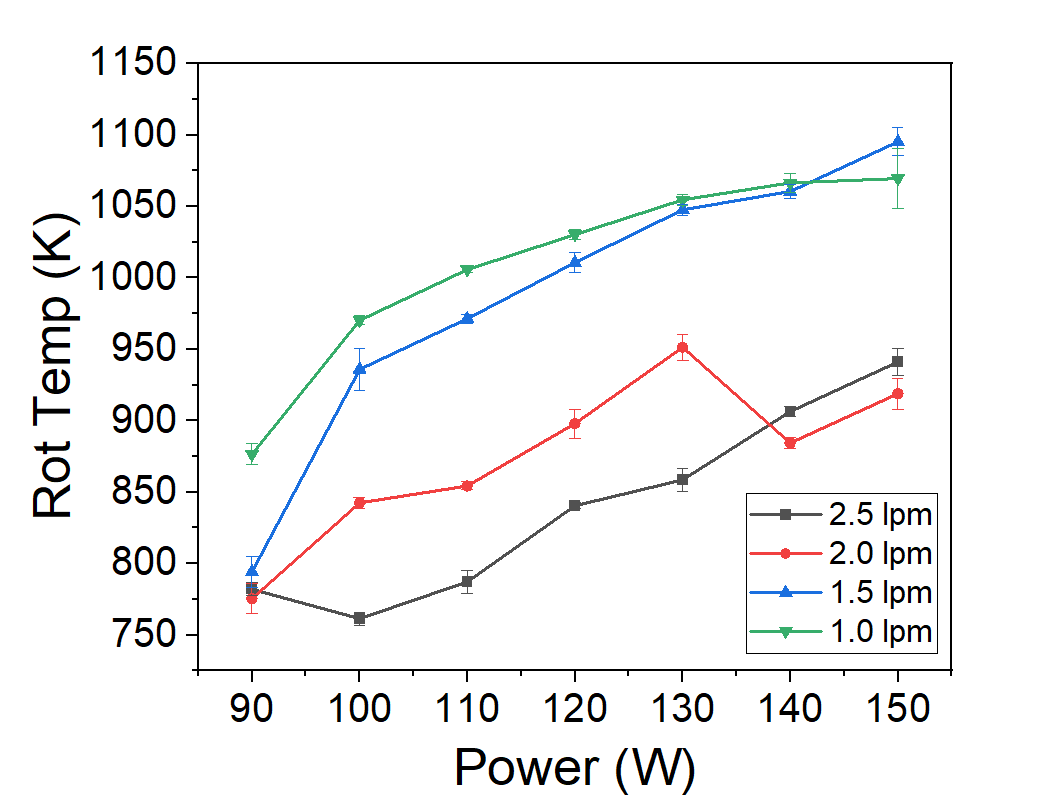
Figure 2. Rotational temperatures of N₂ and OH vs RF power and flow.
Plasma Fingerprints
Broadband emission spectra revealed the active species inside:
- Fe I / Fe II lines from evaporated and ionized iron.
- OH radical from trace water impurities.
- Ar carrier gas lines.
- N₂ bands spanning 280 - 500 nm. Together, these spectral features map the chemistry of this specific RF plasma.
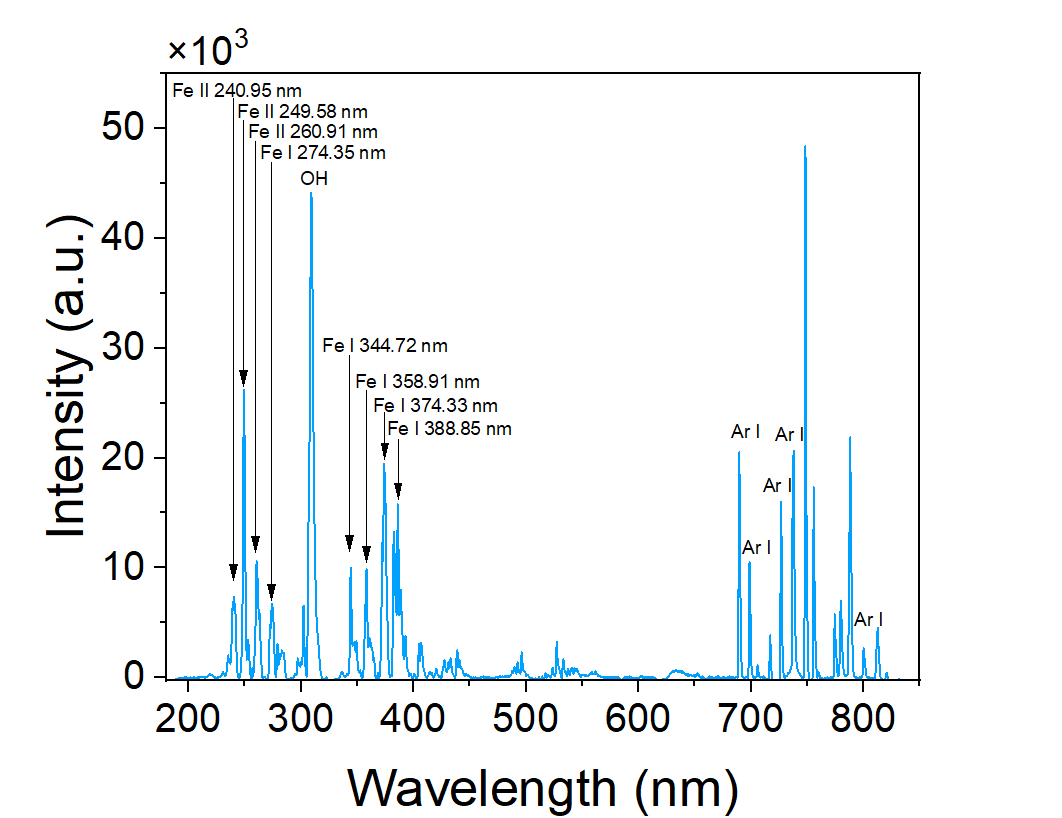
Figure 3. Broadband emission spectrum (190 - 900 nm). Iron, argon, OH, and N₂ features are clearly identified.
These fingerprints confirm the plasma actively vaporizes Fe and sustains a reactive environment for nanoparticle nucleation.
Iron Nanoparticle Formation
Fe nanoparticles exiting the plasma were sized in real time:
- Stable size range: Most conditions produced 3 - 7 nm particles, though a few runs showed slightly broader tails.
- Monodisperse distributions: log-normal PSDs at low power (80 W).
- Concentration trend: NP counts dropped from ~10⁸ cm⁻³ at 1.5 lpm to ~10⁷ cm⁻³ at 2.0 lpm, due to shorter residence time.
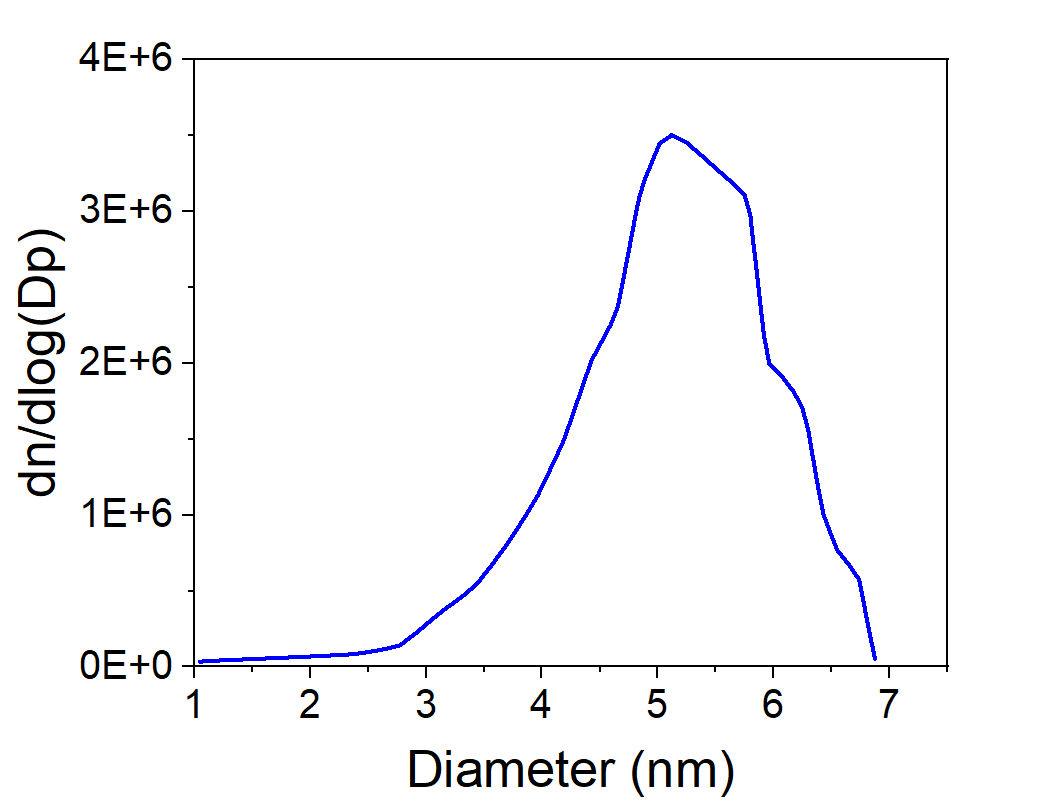
Figure 4. Iron nanoparticle PSDs. Narrow, monodisperse distributions appear, but concentrations fall with higher flow.
Why This Matters
This study shows that:
- Plasma gas temperature can be mapped directly from light.
- Fe nanoparticles form with the right sizes (3 - 7 nm) for CNT growth.
- Concentrations remain low, making ICP a diagnostic tool, not a production reactor.
In other words: ICP plasmas are a controlled environment to study nanoparticle formation, before scaling insights into FCCVD reactors.
Looking Ahead
The next step is to combine this ICP platform with hydrocarbon feedstocks, to directly observe the transition from Fe NP → CNT nucleation.
By pairing plasma diagnostics with nanoparticle analysis, we can finally start controlling CNT synthesis from the ground up. That control could be the key to reproducible CNT quality, not just higher yields.